FlightSure
Using Machine Learning to Find the Chance a Flight is on Time.
Introduction
I had recently returned to San Jose after visiting my family across the country. While waiting at Logan Airport in Boston, I was watching the snowfall and wondered if it would delay my flight. It had just started and light snow is a normal occurrence for the area, so it was unlikely but possible. I then considered San Jose’s Airport. While they have different weather they need to account for, there is no infrastructure in place for even light snow. In addition, many drivers would not know how to handle slippery roads, which would probably cause significant problems across the city.
While I can’t do much about the weather, I wanted to see if I could put a numerical value to the chance my flight would be delayed or canceled as an outside observer.
Verifying Intuition
Flights are often canceled only a few hours before they otherwise would be scheduled to take off. The airline’s app or website is the best you can make plans around, but I wanted to try to predict what would happen up to a few days in advance.
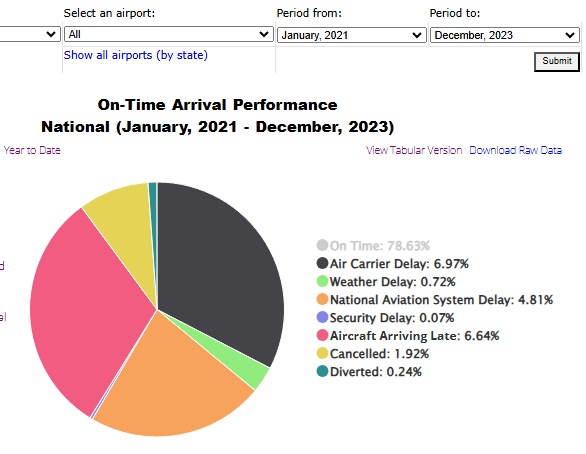
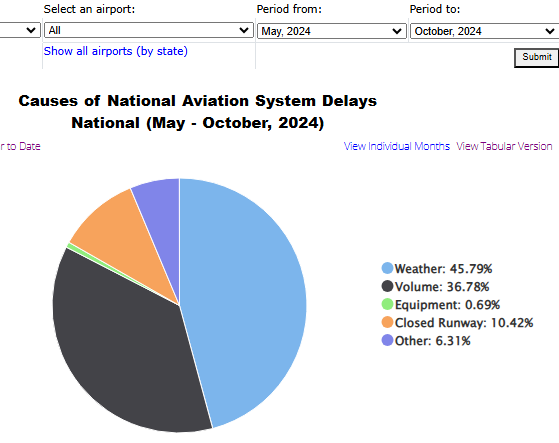
The first thought would be that most flight problems, and the easiest to predict, are ones due to weather. A look at the United States Department of Transportation (US DOT) statistics shows that this assumption has some merit. While their page on Airline On-Time Statistics and Delay Causes shows that only 0.22% of all flights are impacted by weather (filter between Jan 2021 and Dec 2023). This statistic fails to account for National Aviation System Delays which make up the greatest category of flight problems outside of delayed arrivals and “air carrier delays”. Looking into National Aviation System Delays further, weather makes up almost half of all delays in this category. While there are clearly several other factors that can cause flights to be delayed, predicting based on weather seemed like the best predictor we could realistically use without insider knowledge of internal systems.
Gathering Data
The US DOT and National Oceanic and Atmospheric Administration (NOAA) both have public records of statistics in their respective domains freely accessible to the public. I wanted to build classical machine learning models for each airport to measure delays and cancellations, so I needed to merge tabular data based on time and airport to find under what conditions cancellations and delays occur.
NOAA has a page called Past Weather by Zip Code - Data Table Which was available to the public to access weather reporting. While this looked like everything I needed, there were problems working with it, and I ended up using Automated Surface Observing System (ASOS) Network instead. A frontend to the data was available through Iowa State University, which had more data and hourly reports from all major US airports, which was perfect for our use case. Similarly, the US DOT has a page called On-Time : Reporting Carrier On-Time Performance (1987-present) which allows the public to get extremely detailed information on exact logs of airline cancellations and delays. I decided to get the past three years of data for the 30 most popular airports in the country.
Data Cleaning and EDA
I needed to clean the data, converting times and locations to exactly match between datasets, and merge the two together. Interacting with such a large dataset turned out to be unreasonable for the software I was using, so I decided I would split the data by airport and loop over the datasets separately so I would not encounter any issues with size.
I then needed to figure out which weather variables most correlated with flight problems so I would not be passing in useless information to the model. I created a heatmap correlating weather events to delays and cancellations and removed all the variables that looked like they had no impact on the flight.
Another issue I found when preparing for modeling was the imbalance of classes. About ten percent of the flights were delayed, with many only being delayed a few minutes. I decided that I should classify between lengths of time delayed when classifying delays, but I should have another model that predicts how long it will be delayed as well.
Studying how models perform under a class imbalance, I used weighted class random forests for classification, and I applied simple linear regression to predict the length of the delay. I only would attempt to find the length of the delay if there was a greater than 50% chance that the flight would be delayed according to the model. Due to this, the training data of the model only consisted of the delayed flights.
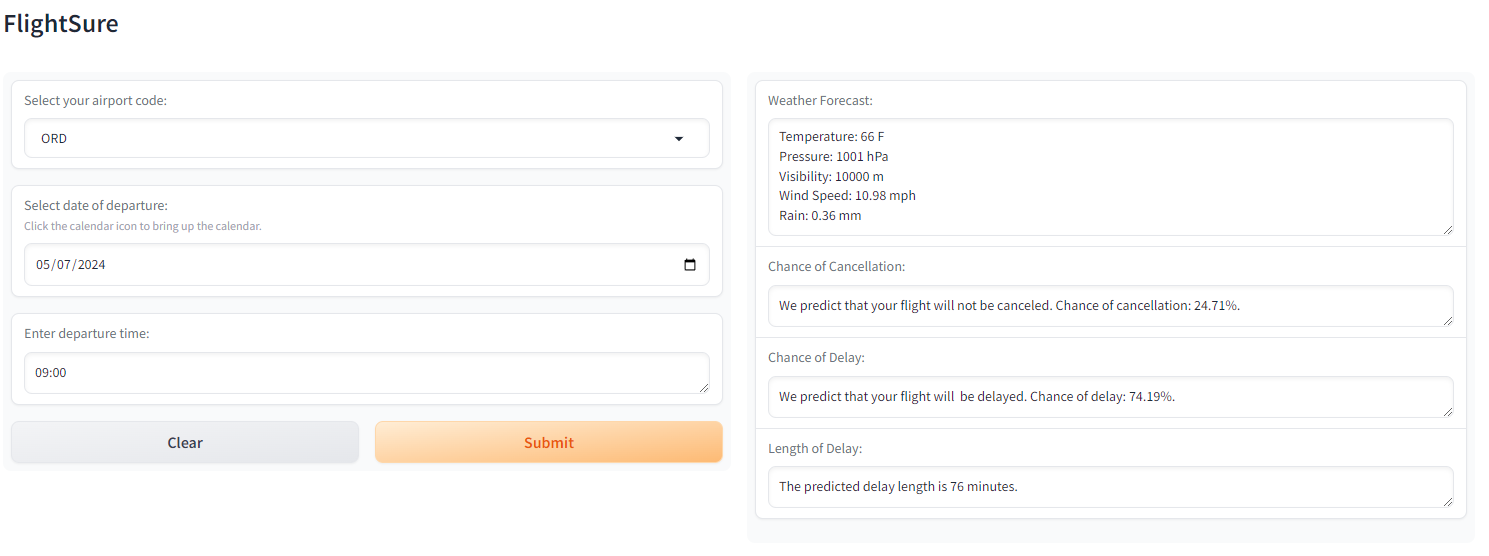
Final Application
Making my work into an end-user application for people is important to me. When discussing ideas with people, having proof of a model or algorithm working is often not enough. To make the idea “click” for people, some type of interface where the user can play around is needed.
If I am accepting user input, users will not want to input all of the model’s variables by hand. Instead, it would be much more reasonable if they only need to pass in the airport and time of departure, and we can do the rest automatically. To do this, of course, we need access to a weather API. I found that OpenWeather’s 5 Day Forecast worked extremely well for our use case. It’s free and as this was not meant to be published, I only need a few dozen called for bug testing and showing off the proof of concept. Thankfully, the API had all the data I trained my model on. I had a drop-down to choose the airport, so I then converted the airport into location data for OpenWeather’s format and then parsed the JSON response to get all the necessary values to pass into the correct model. Finally, I could hook all of this up to a Gradio front end. Gradio is made for easy front ends for AI applications, which I could easily publish on HuggingFace so that anyone could interact with it as part of their “Spaces” feature. As all source code is available on HuggingFace spaces, I needed to add an OpenWeather API input field, but by hosting it on HuggingFace anyone can still use the app on the web.
Conclusion
This was my project for my Data Mining class at San Jose State University. I made a slide show to show off the work to the class, which I attached below. The main point of the class was finding the databases and cleaning the data to be used for modeling. I built the fun little Gradio app on top, but doing that is a necessity when showing off a work like this.
I don’t think the skills I learned in this project are that notable. Anyone in AI needs to dig through data and Gradio is an industry standard for being an easy framework for non-UI developers. It was, though, a critical step in my education, proving I know how to do these things. While I don’t expect this application to be used by anyone, it lays the groundwork of my knowledge so that when I approach future machine learning problems that are novel and complex, I have the work I did here in the back of my mind as reference for how to solve tomorrows problems.
The app is available on HuggingFace at: https://huggingface.co/spaces/Jaspann/FlightSure
The dataset I used it on Kaggle at: https://www.kaggle.com/datasets/williamparker20/flight-ontime-reporting-with-weather/data